Файл:US timeline. Drugs involved in overdose deaths.jpg
Перейти к навигации
Перейти к поиску

Размер этого предпросмотра: 800 × 600 пкс. Другое разрешение: 1200 × 900 пкс.
Исходный файл (1200 × 900 пкс, размер файла: 169 Кб, MIME-тип: image/jpeg)

|
Существует векторная версия этого изображения. Её следует использовать, если качество её не хуже, чем эта растровая версия.
File:US timeline. Drugs involved in overdose deaths.jpg → File:US timeline - Drugs involved in overdose deaths.svg
Подробнее о векторной графике в статье «Перевод изображений в формат SVG». Также доступна информация о поддержке формата SVG в MediaWiki. |
 |
Краткое описание
| Описание |
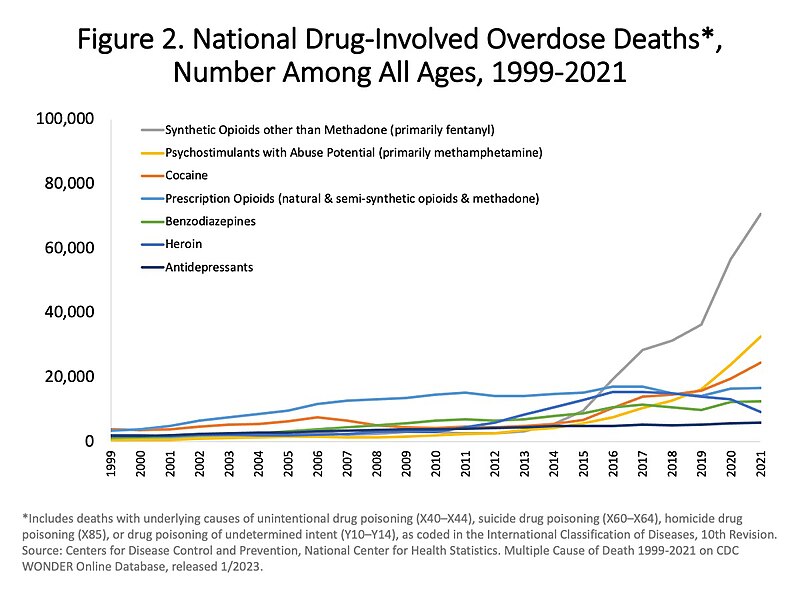
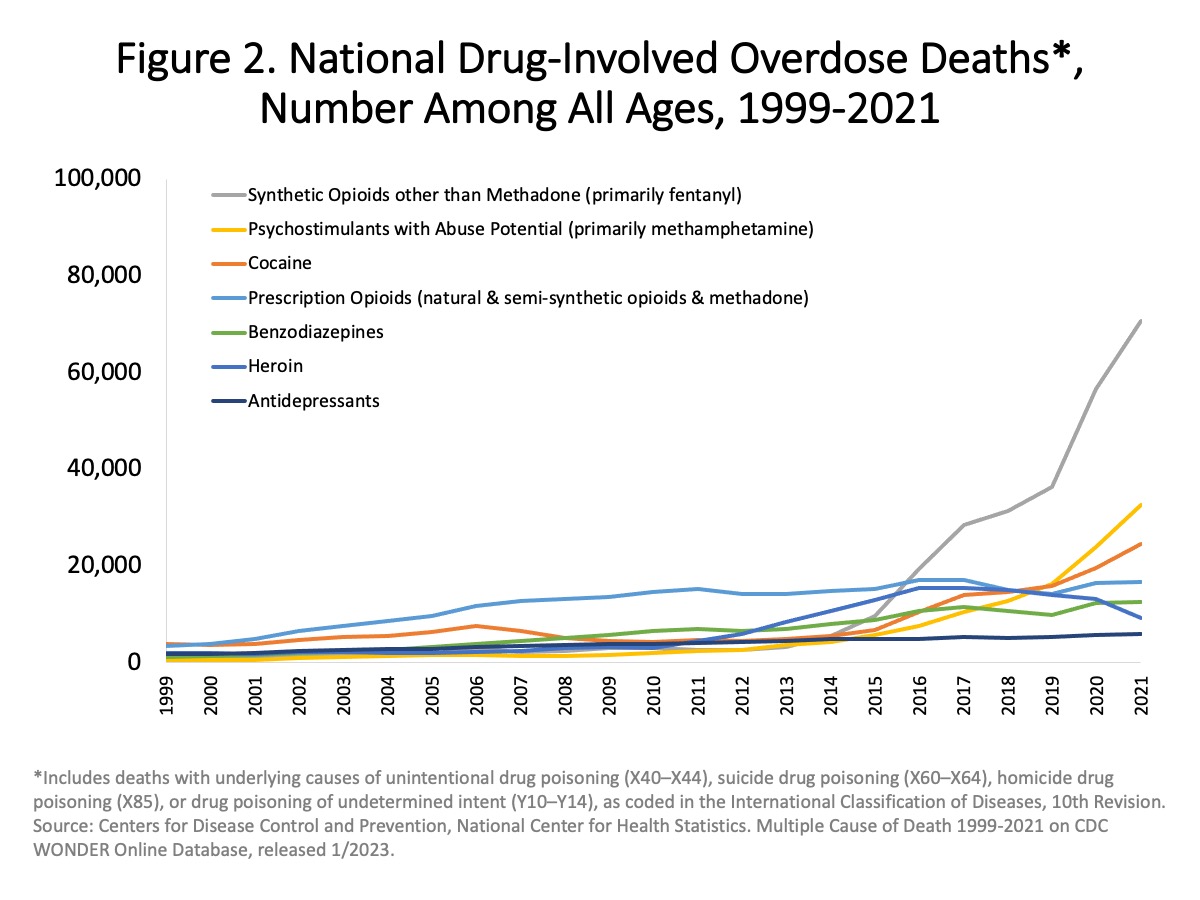
English: From source: "Figure 2. National Drug-Involved Overdose Deaths by Specific Category—Number Among All Ages, 1999-2021. Overall, drug overdose deaths rose from 2019 to 2021 with more than 106,000 drug overdose deaths reported in 2021. Deaths involving synthetic opioids other than methadone (primarily fentanyl) continued to rise with 70,601 overdose deaths reported in 2021. Those involving stimulants, including cocaine or psychostimulants with abuse potential (primarily methamphetamine), also continued to increase with 32,537 overdose deaths in 2021 (Source: CDC WONDER)." |
| Дата | - date of first upload to the Commons. See file history for dates of later uploads. |
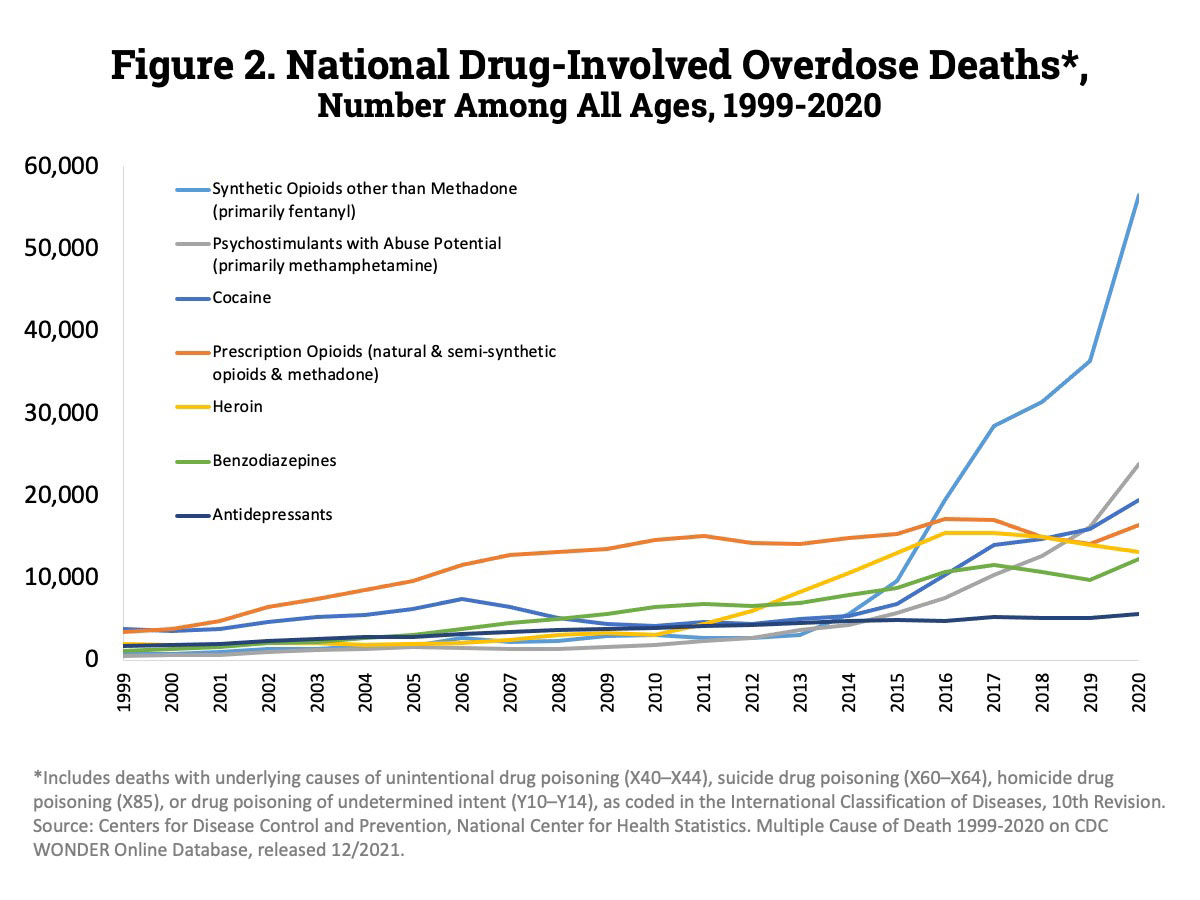
| Источник | Overdose Death Rates. By National Institute on Drug Abuse (NIDA). See links section near the bottom of the page for the latest data link, and a PowerPoint link. See also CDC's searchable database, called CDC Wonder. 1999-2021 chart. 1999-2020 chart. 1999-2019 chart. 1999-2017 chart from PDF with larger version of chart. 1999-2017 provisional chart. 2000-2016 chart. |
| Автор | National Institute on Drug Abuse. On some versions of the chart here on the Commons User:Timeshifter used freeware IrfanView to crop out the outer white space, edit text at the top, and add a border. See Commons:Convert tables and charts to wiki code or image files, and the section about adding and editing text on chart images. |
Лицензирование
This image is a work of the National Institutes of Health, part of the United States Department of Health and Human Services, taken or made as part of an employee's official duties. As a work of the U.S. federal government, the image is in the public domain.
 |
||
| Этот файл был определён как свободный от известных ограничений авторского права, а также связанных и смежных прав. | ||
История файла
Нажмите на дату/время, чтобы увидеть версию файла от того времени.
| Дата/время | Размеры | Участник | Примечание | |
|---|---|---|---|---|
| текущий | 02:37, 22 июля 2023 | 1200 × 900 (169 Кб) | wikimediacommons>Jmabel | updated again |
Использование файла
Следующая страница использует этот файл: